Mikhail Naganov
Little Toolbox for Stereo Filters Analysis
Since I’m very interested in studying different implementations of crossfeed filters, I came up with a little toolbox for GNU Octave that helps me to compare and decompose them.
Although some of this analysis can be performed using existing software tools, such as FuzzMeasure (FM) or Room EQ Wizard (REW), my little toolbox offers some nice features. For example:
- convenient offline processing—analyze the filter by processing stimulus and response wave files; although this functionality exists in FuzzMeasure (but not in REW), it isn’t very convenient for use with binaural filters like crossfeed, because FM assumes stimulus and response to be mono files;
- microsecond precision for group delay; both FM and REW show group delay graphs, but their units of measurement is milliseconds (makes sense for acoustic systems), whereas in filters induced delays are usually thousand times smaller;
- IIR filter coefficients computation from frequency response.
The toolbox supports different representations for the filter specification:
- a pair of stimulus and response wave files; the stimulus file is a stereo file with a log sweep in the left channel; when this file is processed by a typical crossfeed filter, the response wave file is also stereo, and receives the processed signal in both channels with different filters (that’s the essence of crossfeeding);
- a csv file with frequency response of a filter (magnitude response and phase response) for both channels, or two csv files one per channel;
- IIR transfer function coefficients (vectors traditionally named “B” and “A”) for each channel, and the attenuation value for the opposite channel.
The functions of the toolbox can convert between those representations, and plot frequency response and group delay for both channels, and for a pair of filters for comparison.
Usage Example
Let’s perform an exercise of applying these filters to the BS2B implementation of crossfade filter. Although there is a source code and a high level description of this implementation, we will consider the filter to be a “black box”, and see if we can reverse engineer it.
Preparing Stimulus File
We need a sine sweep from 20 Hz to 20 kHz in order to cover the whole audio range. It turns out, that generating a sweep that best suits our task is not as easy as it might seem. The sweep wave must be as clean as possible (free of noise and other artifacts). Audacity can generate sine sweeps, but the produced signal contains aliasing artifacts that can be clearly seen on the spectrogram. REW also can generate sweeps, and they are free from aliasing, but the log sweep it’s not perfect on the ends.
The best sweep I was able to find is generated using an online tool called “WavTones”. Here are the required settings:
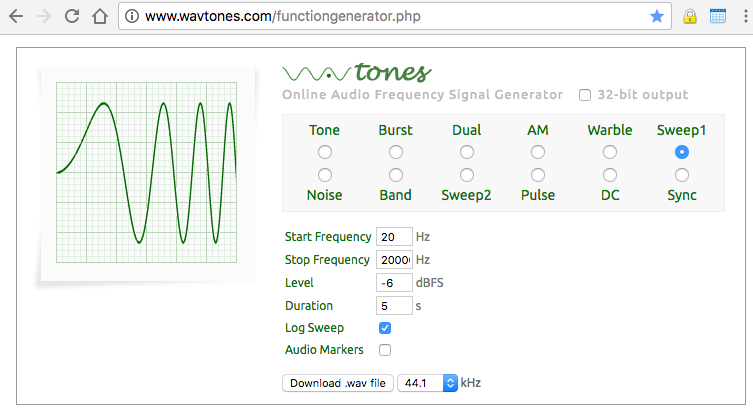
The downloaded WAV file is mono. For the purpose of analyzing the crossfeed filter, we need to make a stereo file with the right channel containing silence. We will use Audacity in order to make this edit.
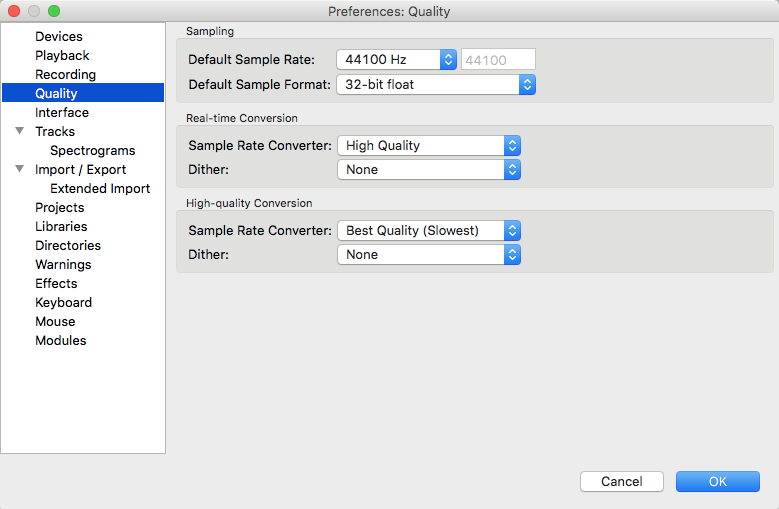
But before doing any editing, let’s make sure that Audacity is set up properly. What we need to do is to turn off dithering, as otherwise Audacity will inject specially constructed high-level noise when saving files. This usually improves signal-to-noise ratio when playing them, but for us this is undesired, as it will result in contamination of the frequency response with noise. Turning off dithering is performed by setting the “Quality” preferences as follows:
Now we can load the mono log sweep file generated by WavTones, add a second track, and generate silence of the same length as the log sweep. Then make the sweep track “Left Channel” and the silence track the “Right Channel” and join them into a stereo track. The resulting stereo sound wave should look like as below. It needs to be exported as a 16-bit WAV file.

Preparing Response File
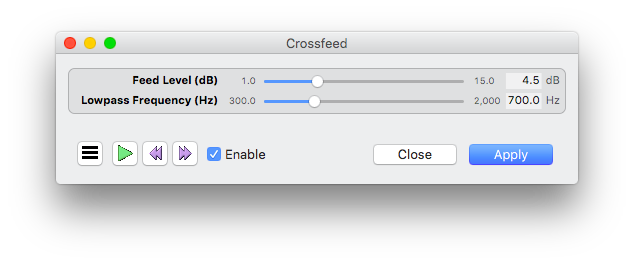
I’m using the OS X AudioUnits BS2B implementation assembled by Lars Ggu (?). Audacity can apply AudioUnit filters directly:
After applying BS2B to our stimulus stereo wave, the resulting wave (filter response) looks like this:
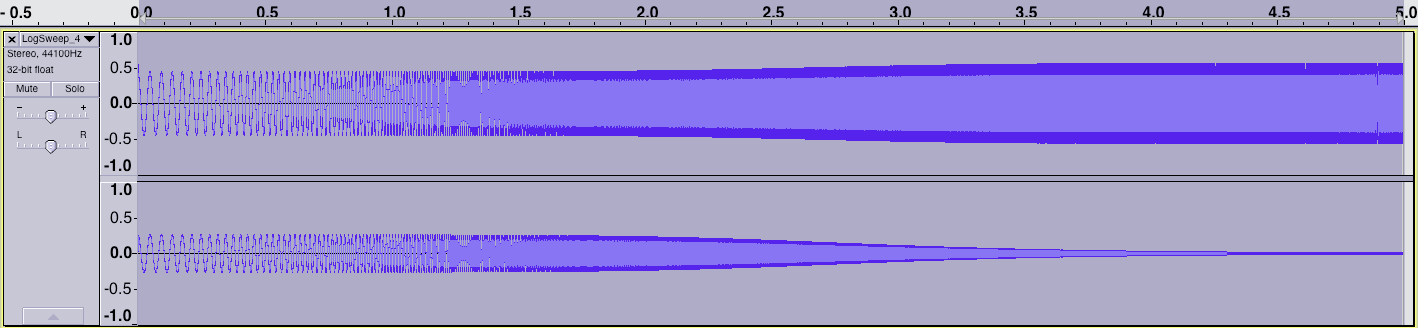
As it can be seen, in the response wave the left channel has low frequencies attenuated, whereas the right channel contains a copy of the source wave passed through a low-pass filter, and also attenuated, but by a different value.
Plotting Frequency Response and Group Delay
With my toolbox, this is a straightforward operation. The function
plot_filter_from_wav_files takes two stereo wav files for the
stimulus and the response, and produces a plot in the desired frequency
range:
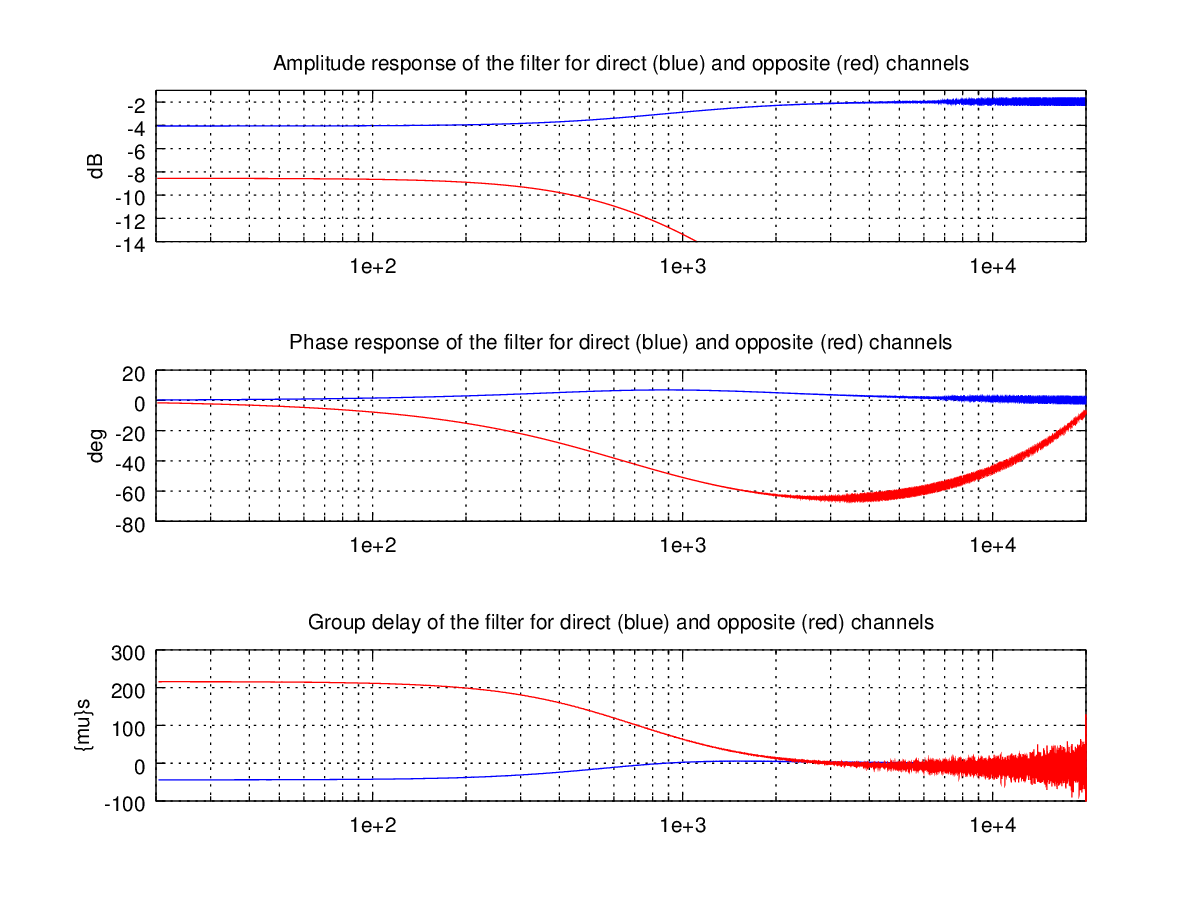
There is a noticeable jitter in the opposite channel’s graph starting at about 2000 Hz mark which is especially visible on the group delay plot. I’m currently working on implementing better smoothing. This is the code of the script that produces these graphs:
fig = plot_filter_from_wav_files(
  [20, 20000],                                % frequency range
  'sweep_20Hz_20000Hz_-6dBFS_5s-LeftCh.wav',  % stimulus file
  'bs2b-sweep_20Hz_20000Hz_-6dBFS_5s.wav',    % response file
  [-14, -1],                                  % amplitude response plot limits
  [-100, 300],                                % group delay plot limits
  200);                                       % gd plot smoothing factor
print(fig, 'plot-bs2b.png');
The plots do correspond with the filter parameters we have specified: the difference in amplitude between direct and opposite channels feed is 4.5 dB, and the opposite channel lowpass filter achieves -3 dB attenuation at 700 Hz. This also corresponds with the original plots on the BS2B page for this filter setting, except that the group delay there is plotted upside down (due to a wrong sign in the group delay calculations in the script provided).
Cross-check with FuzzMeasure
Since FuzzMeasure also allows offline stimulus-response analysis, I’ve cross-checked the results with it. FM also provides fractional octave smoothing which gets rid of those nasty jitters I have in the plots produced by my Octave scripts:


As I’ve noted earlier, FM use milliseconds instead of microseconds for group delay. Another inconvenience was the need for saving left and right channel responses as separate audio files.
BTW, FM also produces good quality log sweep waves which can be reliably used for analysis. But the stimulus file generator can only be parametrized on the sampling frequency, and file bit depth.
To Be Continued
This was a very simple example, I will come up with more interesting cases in upcoming posts.